
A Canvas Grid That Renders a Million Rows in the Browser
Somewhere early in building Updog's data editor, I ran into the wall every table library eventually hits. Render rows and cells as ordinary HTML elements, and it works well, right up until the row count climbs past some tens of thousands. Past that, scrolling starts to stutter, memory climbs, and the browser tab spends its effort holding a page open instead of running a spreadsheet. I needed an editor that stayed smooth at a million rows, inside a browser tab, with no server doing the heavy lifting. That ceiling is why Updog's grid draws its own rows and cells on a canvas instead of building them out of HTML.
I already wrote about why one million rows is the practical ceiling Updog is built around, and why the browser can carry more of that weight than it usually gets credit for. Underneath that claim is a set of specific decisions inside the grid engine, the ones that let a million rows scroll as smoothly as a hundred.
Why a normal table stops at some point
Every serious web data grid virtualizes, rendering only the rows on screen instead of the whole dataset as DOM nodes. AG Grid's own documentation puts it plainly: "The grid only renders what you see on the screen." AG Grid still renders a buffer by default, 10 rows above and below what is visible, plus a hard cap of 500 rows at once. The wider TanStack Table docs are candid that the stack is "designed to scale up to 10s of thousands of rows with decent performance."
None of this is a mark against those tools. It is what happens when the unit of rendering is a DOM element, which carries layout and paint cost that a canvas pixel does not. Updog's grid moves drawing off the DOM entirely, painting rows and cells with the 2D canvas API so the browser manages one element instead of a million. Row count has not stopped mattering, a million rows still sit in the tab's memory and that cost is real, but the render cost per frame no longer scales with dataset size. It scales with viewport size instead, and the rest of the engine is built around making one full repaint of that viewport cheap.
Scrolling past a browser's pixel limit
Canvas creates a problem of its own immediately. Something still has to scroll, and a canvas element has no scroll behavior built in. Updog's grid solves that with two invisible, empty divs, one for vertical scroll and one for horizontal, given native overflow-scroll. Wheel events and scrollbar drags both move the same track, and the canvas repaints in response.
At a million rows and a fixed row height of 34 pixels, that content is 34 million pixels tall, past what browsers allow. Chrome and Safari cap element height around 33.5 million pixels, a fixed-point integer limit in their layout engines, and Firefox's cap sits lower, around 17.9 million pixels. Updog's grid keeps the invisible vertical sizer under a 10 million pixel ceiling, safely below both, shrinking it by a whole number factor as row count grows, and remaps scroll position between that physical space and the full virtual height.
/** Browsers cap element heights around 33.5M px (Chrome/Safari) or 17.9M px (Firefox); stay well below both. */const MAX_SCROLL_HEIGHT = 10_000_000;
function computeMultiplier(rowCount: number): number {  const totalContent = rowCount * CELL_HEIGHT;  return Math.max(1, Math.ceil(totalContent / MAX_SCROLL_HEIGHT));}
export function toVirtualScrollTop(  scrollTop: number,  viewportHeight: number,  rowCount: number,): number {  const multiplier = computeMultiplier(rowCount);  if (multiplier === 1) {    return scrollTop;  }  const sizerHeight = getSizerHeight(rowCount);  const maxBrowser = Math.max(1, sizerHeight - viewportHeight);  const maxVirtual = Math.max(1, rowCount * CELL_HEIGHT - viewportHeight);  return (scrollTop / maxBrowser) * maxVirtual;}
The mapping is exact at both ends, so scrolling all the way down lands precisely on the last of a million rows, not somewhere close to it. The person dragging a scrollbar is moving a normal, short track, and the grid does the arithmetic that turns it into a position across 34 million virtual pixels.
No buffer rows, on purpose
I had tested DOM-based tables before building this one, including a custom grid of my own, with overscan and a row buffer both in place. On large datasets, that was still not enough. Blank rows flashed through while they waited to load, then filled in a moment later. The flash is brief, but it is visible on a fast scroll, and I wanted a version where it did not exist at all. That felt like the right problem to take on.
Updog's grid renders no extra rows above or below the visible window. The visible range comes directly from scroll position and a fixed row height, and the paint loop draws exactly that range.
this._rowRange.start = Math.max(0, Math.floor(this.scrollTop / CELL_HEIGHT));this._rowRange.end = Math.min(totalRows, Math.ceil((this.scrollTop + this.viewportHeight - HEADER_HEIGHT) / CELL_HEIGHT));Columns are variable width, so finding which one sits under a given position runs a binary search over cumulative widths instead of arithmetic, but either way the loop only touches what is on screen. Removing the buffer is not a separate trick, it falls out once a full repaint is cheap enough that there is nothing left to hide. The next two sections show what makes that true.
Redrawing everything
Most rendering systems built for scale track which regions changed and repaint only those. Updog's grid does not. Every frame that repaints clears the canvas and redraws the entire viewport in the same fixed order, cell backgrounds, gridlines, selection, overlays, pinned columns, marker column, header, corner, and resize guide.
What it does track is whether a frame needs to happen at all. A version counter covers everything that can invalidate the canvas, the data store, selection, the cell being edited, clipboard, fill handle, columns, scroll, theme, viewport size, and painting only runs if one of them changed.
const versionsUnchanged = cur.store === prev.store && cur.selection === prev.selection && cur.editing === prev.editing && cur.clipboard === prev.clipboard && cur.fill === prev.fill && cur.columns === prev.columns && cur.scrollLeft === prev.scrollLeft && cur.scrollTop === prev.scrollTop && // ... viewport size, find/replace, theme version, resize guideif (versionsUnchanged) { return;}When nothing moved, the grid skips the frame. When something did, one requestAnimationFrame call runs the full repaint, requested exactly once per change, so an idle grid uses no CPU at all.
const markDirty = useCallback(() => { if (!dirtyRef.current) { dirtyRef.current = true; rafIdRef.current = requestAnimationFrame(paint); }}, [paint]);Clearing the canvas is the first of ten ordered drawing passes, an opaque fill over the viewport before everything else is drawn on top.
ctx.fillStyle = theme.cellBgIdle;fillRectSnapped(ctx, 0, 0, vpW, vpH);Comparing those version numbers costs almost nothing. Painting the full viewport is the expensive part, and keeping that cheap is what the next section covers.
Making every frame cheap to draw
The canvas context itself is set up cheap from the start, created with alpha: false so the browser never composites against whatever sits behind it, plus desynchronized mode where the browser supports it.
const ctx = canvas.getContext("2d", { alpha: false, desynchronized: useDesync });The bigger cost is text. measureText and fillText do not scale cleanly to a large number of strings, a complaint old enough that a Firefox bug was filed on it back in 2009, and a cell grid draws a string in almost every visible cell.
Every measureText call goes through a cache with no exceptions, holding full-string widths and per-character widths that barely change once loaded for a font. Eviction is generational rather than tracked by recency. Once the cache passes 10,000 entries, the whole map demotes at once and a fresh one takes over, with old entries promoted back up on a hit, costing one comparison per lookup instead of recency bookkeeping.
/** * Cache for ctx.measureText() results — the single most expensive call in canvas text rendering. * Two-level cache: full string widths (generation-based eviction at 10k cap) * and individual character widths (never evicted, ~96 entries per font). */const prev = this._prevCache.get(key);if (prev !== undefined) { this._cache.set(key, prev); // promote on prev-generation hit return prev;}ctx.font = font;const width = ctx.measureText(text).width;if (this._cache.size >= this._maxSize) { this._prevCache = this._cache; // demote whole map, O(1) eviction this._cache = new Map();}Truncating an overflowing value reuses the same cache, a forward scan of cached character widths until the running total passes the available space, then an ellipsis appended to the slice that fits. Not a binary search, but every width it touches was already cached.
let cumWidth = 0;let truncateAt = 0;for (let i = 0; i < text.length; i++) { cumWidth += cache.measureChar(ctx, text, i, font); if (cumWidth > available) { break; } truncateAt = i + 1;}ctx.fillText(text.slice(0, truncateAt) + ELLIPSIS, sx, sy);Formatted values, the string a number or date turns into on screen, get the same generational cache, thrown out wholesale whenever the data changes. A date column shows why it matters. Building an Intl.DateTimeFormat instance is expensive, calling it once built is cheap, so the grid builds one per format and reuses it for every cell in that column.
The rest of a frame's cost comes down to draw-call count. Cells sharing a background are filled together under one fillStyle assignment, and every gridline in the viewport, horizontal and vertical, is added to a single path and stroked once.
ctx.beginPath();// Horizontal linesfor (let r = rowRange.start; r <= rowRange.end; r++) { /* moveTo/lineTo */ }// Vertical linesfor (let c = colRange.start; c <= colRange.end; c++) { /* moveTo/lineTo */ }ctx.stroke();Text is the honest exception. Every non-empty cell gets its own fillText call, with font and color reassigned inside that loop, since a cell's color can differ from its neighbor's in a way a shared fill never has to account for.
ctx.font = theme.font;ctx.fillStyle = isCut ? theme.cellContentCut : theme.cellContentIdle;Theme colors come from one getComputedStyle call, read once into a plain object rather than looked up per cell. A MutationObserver bumps the theme version on a dark mode change, one more counter the frame-skip check above already watches.
Keeping the main thread free while the grid works
None of this matters if loading or filtering a million rows freezes the tab first. Updog moves the heavy, one-shot work off the main thread and keeps only what needs to be there.
| Work | Thread |
|---|---|
| CSV/JSON parse, CSV/TSV/JSON/XML export | Text worker (PapaParse lives here) |
| XLSX/XLS/XLSB/ODS parse and export | Sheet worker, lazily loaded (SheetJS) |
| Filtering and sorting | Filter worker |
| Validation | Main thread, cooperatively chunked |
| Formatting | Main thread; the filter worker receives pre-formatted strings |
The filter worker does the most unusual thing on that list, it is never handed row objects. The main thread mirrors data into it as parallel arrays instead, row IDs, pre-formatted cell text joined by a null character, raw text for numeric and date comparisons, and a per-row status flag in a typed array, kept in sync through messages like APPEND, INSERT, DELETE, and UPDATE_TEXT. A filter or sort runs entirely inside the worker, cheapest checks first, source visibility, then status, then empty cells, before the costlier column-value, range, and text-search comparisons, and returns only matching row IDs, never the rows themselves.
Validation stays on the main thread on purpose, since it updates the same store the grid reads without a worker round trip, but it never blocks a frame for a full million rows at once. It runs in chunks, yielding between them with a MessageChannel message instead of setTimeout(0), to dodge the browser's roughly four millisecond floor on nested setTimeout calls.
The file itself is never copied to the main thread to get parsed, it is handed to the parsing worker by reference, and the result comes back as one message rather than a stream. XLSX has no main-thread fallback at all, that format needs a worker.
Accessibility without a million DOM nodes
Drawing the grid on canvas solves the row-count problem, but it opens an accessibility one immediately. A canvas has no structure a screen reader can read at all. Updog's answer is a second, offscreen table that exists only for assistive technology, built with the same grid semantics a real HTML table would carry. Here is what that table renders in the browser, trimmed to three columns with mock data.
<div class="updog-grid-a11y"> <table role="grid" aria-rowcount="1001" aria-colcount="3" aria-label="Data editor"> <thead> <tr aria-rowindex="1"> <th role="columnheader" aria-colindex="1">First Name</th> <th role="columnheader" aria-colindex="2">Last Name</th> <th role="columnheader" aria-colindex="3">Email</th> </tr> </thead> <tbody> <tr aria-rowindex="2"> <td role="gridcell" aria-colindex="1">Richard</td> <td role="gridcell" aria-colindex="2">Young</td> </tr> <tr aria-rowindex="3"> <td role="gridcell" aria-colindex="1">Joseph</td> <td role="gridcell" aria-colindex="2">Anderson</td> </tr> </tbody> </table> <div aria-live="polite" aria-atomic="true" class="updog-grid-a11y__live"></div></div>That table is virtualized the same way the canvas is, only the visible row window renders into it, synced on a short debounce as the person scrolls, so accessibility support does not bring back a million real DOM nodes. Navigation and selection changes are announced through a live region, reading out the row, column, and value, in English and Arabic both.
Where canvas earns its cost
None of this is free to build, and canvas is not the right call for every table. A settings page with forty rows needs a table element, not a rendering engine, since a table is simpler, accessible by default, and easier for the next developer to reason about. Canvas earns its cost for the shape of problem Updog exists to solve, a spreadsheet-like editor that stays responsive at row counts a normal DOM table was never built to hold, in a browser tab with no server behind it.
That is not a claim that other data grids are doing it wrong. Most solve a wider problem than Updog does, with more configuration surface and years more track record. Updog's grid is narrower on purpose. It is read-heavy and edit-heavy, holds up to around a million rows, and is built for importing and correcting a real file rather than every shape a data grid can take.
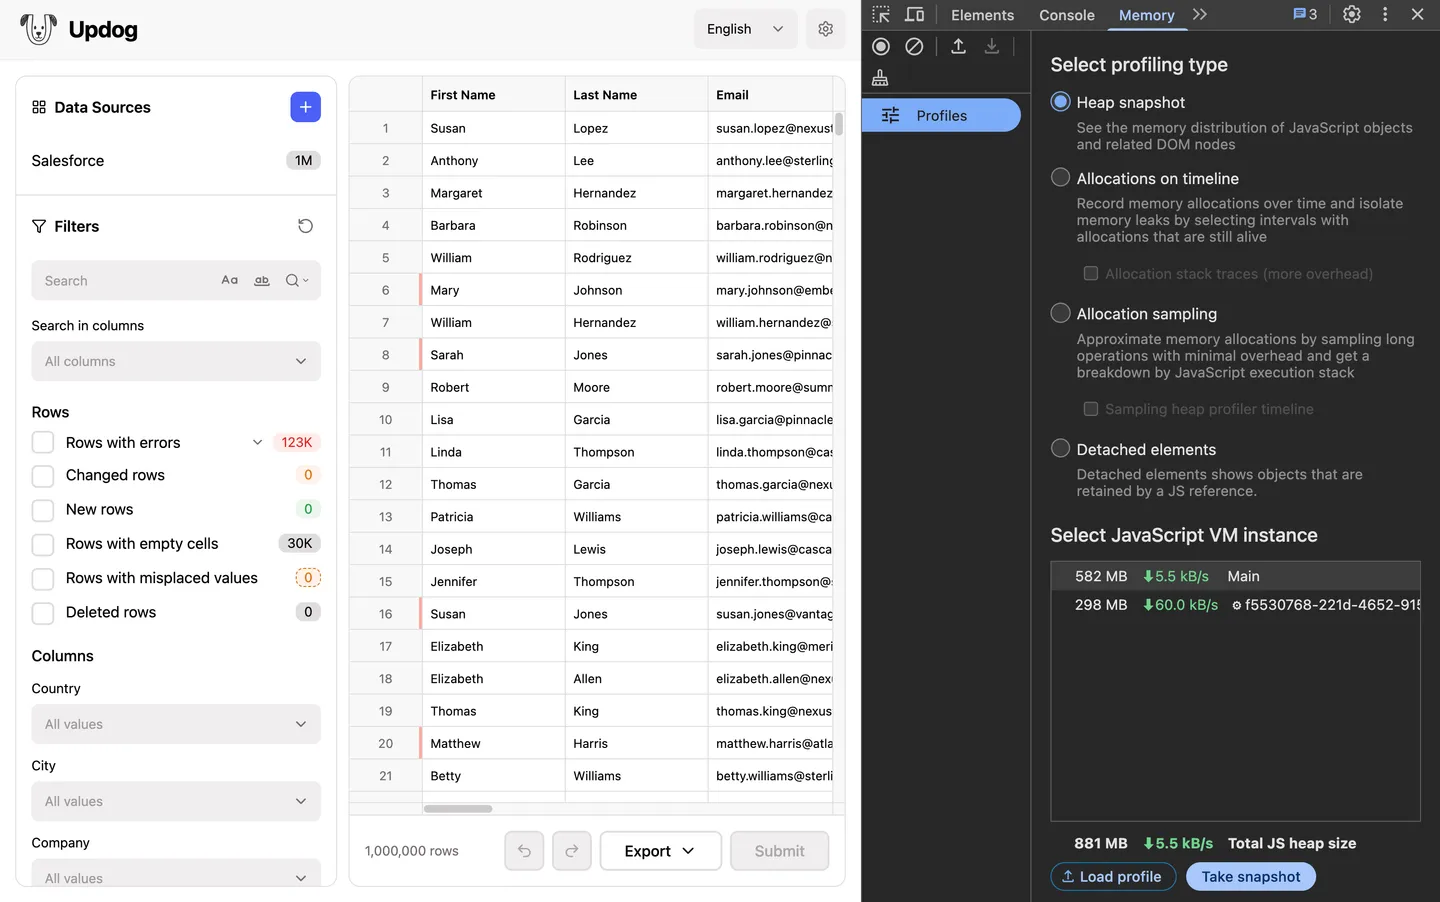
The recording below is one unedited take, scrolling a million generated rows with Chrome's own FPS meter visible in the corner of the frame. The screenshot after it is Chrome's memory tooling reading the JS heap on the main thread and inside the filter worker, taken after importing and filtering that same million rows and letting the browser's garbage collector settle. Both are here so the numbers are something a reader can go verify by installing the package and trying it, not something to take on faith from a spec sheet.
In everyday use, a million-row import is rare. A typical file is a few thousand rows, and at that size the engine has almost nothing to do. But large files do arrive, and when one does, the headroom is already there.